General Comments About Some Toolbox Widgets
This article will enable you to use RawTherapee more efficiently and to take full advantage of features which even an experienced user may not know about. Take a few minutes to read it.
Panels
The Editor tab has three main panels whose visibility can be toggled
using the Show/Hide Panel buttons


 ,
making more room for the image preview.
,
making more room for the image preview.
You can use the mouse scrollwheel to safely scroll the panels up/down without accidentally changing a slider, because RawTherapee requires that you hold the Shift key while using the mouse scrollwheel if your intention is to manipulate a slider or cycle through the options in a drop-down menu (called a “combobox”).
Tools
There are many tools, vertical screen space is limited and scrolling takes time. You can right-click a tool’s title to expand that tool and collapse all other tools in the same tab. This allows you to make the most of the available vertical screen space and to reduce the need for scrolling.
Most tools have a power button to the left of their title which lets you turn that tool on or off. The power button can also have an “inconsistent” state if you select two or more photos in the File Browser and a given tool is turned on in some of the selected photos but off in others. Some tools instead of an on/off button have an “expander” which lets you expand or collapse the contents of that tool.
 Off.
Off.
 On.
On.
 Inconsistent.
 Collapsed.
 Expanded.
Sliders
To adjust a slider, hover the mouse over it and hold the key while scrolling the scrollwheel up/down. Using the mouse scrollwheel without the key scrolls the panel up/down.
Each slider has a fine-tuning mode which reduces the effect of the mouse, allowing you to make very fine adjustments which would otherwise be difficult to make. You will enter fine-tuning mode if you click-and-hold the slider’s adjustment knob for 1 second without moving it. You can also enter or leave fine-tuning mode if you press the key while holding the knob. This is a standard feature of all programs which use GTK+ 3.
Each slider has a “reset” button
 which
behaves as follows:
which
behaves as follows:
resets the slider to the default value, which is hard-coded to 0 for most sliders or to some other value when 0 wouldn’t be appropriate.
+ resets the slider to the value it had initially when you opened that photo.
Curves
RawTherapee has three kinds of curve widgets:
- Tone curves
- Equalizer curves
- Threshold curves
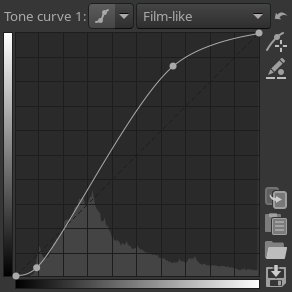
The tone curve.
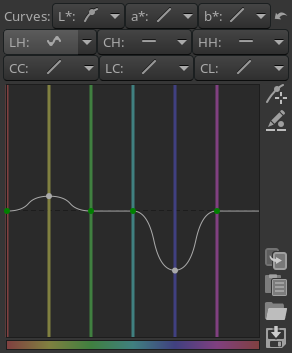
The equalizer curve.
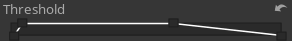
The threshold curve.
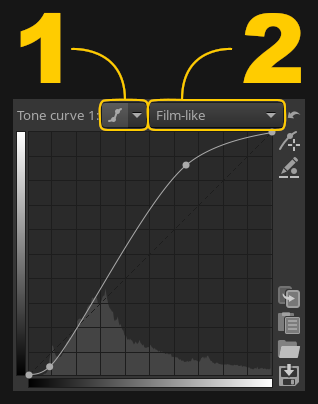
2- Curve mode.
The shape of a tone curve and of an equalizer curve is defined based on control points which you create and position with the mouse. When a curve is linear, that means that the input matches the output, and so the curve has no effect. When a curve is not linear, it has an effect on the image.
A curve is plotted based on the control points which you create and position. The same control points can lead to different curve shapes by changing the underlying math, and you can control this math by choosing a tone curve type in the drop-down list:
 Linear,
 Standard,
 Flexible,
 Parametric,
 Control cage.
You can also click the curve type button to toggle the visibility of the curve. This allows you to make the most of the limited vertical screen space. If a curve is not linear and the tool within which it lies is enabled, then that curve has an effect on the image regardless whether it is visible or not.
Each curve can be reset
to the
default value. Some curves come in groups, such as the Lab Adjustments curves. There is one reset
button for the whole group, and it applies to the currently selected
curve. Click on the curve type drop-down button to select that curve.
Some curves have a color picker
 and a control point in/out value editor
 .
.
Color Picker

Most curves in RawTherapee have a color picker button
 .
The color picker enables you to place a control point in a curve at the
exact spot which corresponds to the area you’re hovering over on the
preview.
.
The color picker enables you to place a control point in a curve at the
exact spot which corresponds to the area you’re hovering over on the
preview.
Let’s say you want to change the hue of a purple flower, to make it more blue. Without the color picker, you would have to guess the exact spot on the curve which corresponds hue of the flower, else the affected range of hues would be too wide and you might end up changing hues you did not want to change. Using the color picker you simply click on the flower and a control point appears on the curve which corresponds to that exact hue. You can adjust that control point as needed.
When the color picker button is clicked, the color picker is activated for the currently selected curve. Now when you hover the cursor over the preview you will notice that a vertical or horizontal line appears in the selected curve. This line represents the value of the pixel you’re hovering over. To place a control point in the curve for the value you’re hovering over, + the preview - a control point will appear in the curve. You can adjust that control point without leaving the preview area, just keep holding the left mouse button after you place the control point, and moving the mouse up and down moves the control point up and down in the curve. Holding while editing a control point decreases your mouse speed so that you can very finely adjust that point. You will usually not require this precision, so after adding a new control point via +, let go of but keep holding the left mouse button.
To deactivate the color picker, either anywhere in the preview area or on the same color picker button again.
You do not need to deactivate the previous curve’s color picker to use it on a new curve, just activate it as usual, and the old one automatically deactivates.
Control Point In/Out Values
Each curve has a button which lets you edit the selected control point’s in/out values. You can use this tool, for example, to match a control point’s “out” value on a photo of a color target to a reference value.
The tool works with control points, and the most likely way you will
create these control points is by using the color picker. For this
example, we will start with a curve without any control points and
create some using the color picker. Click the control point in/out value
editor button
 next to
the curve, and also click the color picker button
.
You will now see “I” (in) and “O” (out) values displayed under the
curve. They correspond to the point under the mouse cursor if you hover
it over the curve or over the preview. Hover the cursor over the
preview. Since you activated the color picker, you can + a spot in the
preview to place a control point in the curve which corresponds to that
spot’s value (whatever that value may be - for example for the L* curve
the value is the lightness of the pixel under the cursor, for the RGB
red curve it’s the red value in the RGB space in the working profile).
Do that, + on a spot in the preview. A control point appears in the
curve. To edit the control point’s in/out values, right-click on the
control point. It turns red with a red ring around it. Now you can edit
the in/out values and see the control point move in real-time. To go out
of control point editing mode once you are done editing, either
right-click anywhere inside the curve area other than on that control
point, or just click the control point value editor button again to
deactivate it.
next to
the curve, and also click the color picker button
.
You will now see “I” (in) and “O” (out) values displayed under the
curve. They correspond to the point under the mouse cursor if you hover
it over the curve or over the preview. Hover the cursor over the
preview. Since you activated the color picker, you can + a spot in the
preview to place a control point in the curve which corresponds to that
spot’s value (whatever that value may be - for example for the L* curve
the value is the lightness of the pixel under the cursor, for the RGB
red curve it’s the red value in the RGB space in the working profile).
Do that, + on a spot in the preview. A control point appears in the
curve. To edit the control point’s in/out values, right-click on the
control point. It turns red with a red ring around it. Now you can edit
the in/out values and see the control point move in real-time. To go out
of control point editing mode once you are done editing, either
right-click anywhere inside the curve area other than on that control
point, or just click the control point value editor button again to
deactivate it.
Tone Curves


Tone curves serve to map an input value (on the horizontal or X axis) to an output value (on the vertical or Y axis). Though they may seem intimidating at first, after a little playing you will quickly develop an intuitive understanding. Curves can do everything “levels” can do and much more, so the sooner you grasp how they work the better.
As an example, look at the “Standard curve” (screenshot to the right) in the Exposure tool. There are grid lines in the background at every 10% interval. The left end of the horizontal (input) axis represents pure black, then the shadows, then the mid-tones, then the highlights, and finally the right end represents pure white. Likewise, the vertical (output) axis represents pure black at the bottom, pure white at the top, and the same graduation between the two. If the curve is linear, i.e. a diagonal straight line from bottom-left to top-right, then the curve has no effect – every point on the curve has an output value identical to its input value. For the curve to have an effect, the line must be non-linear so some point’s output value does not match its input value. The control points you place on the curve are there just to help you control the curve, they do not matter in the calculations – what matters is the curve’s shape. In the example screenshot, a control point in the bottom-left part pushes the curve down: the control point lies at 10% on the “input” axis, but at only 5% of the output axis – this causes dark tones to be made even darker. The next control point lies at 40% on the input axis and 60% on the output axis - those mid-tones will be made brighter. Since only the curve’s shape matters, even though there are no more control points in this example, the curve at input=60% has output=95%, which means that the bright areas will be made very bright, almost white. The curve at input=20% also has output=20%, so those dark tones won’t change between the input and output.
There are multiple types of curves at your disposal:
- Linear
The default type - a straight line that results in no change to input values. The mathematically inclined may observe that it is a graph of y=x. The rest of us just set the control to linear to “turn off” the curve.
- Standard
The type most commonly seen in other software. Click to drop a control point anywhere on the curve and then drag the control point to change the curve’s shape. The top-right point represents the brightest areas in the photo. Drag that point vertically down to make the highlights less bright; move it horizontally to the left to make bright areas brighter, perhaps at the cost of some overexposure. The bottom-left point represents the darkest areas in the photo. Move that point horizontally to the right to make the photo darker, perhaps at the cost of some underexposure. Move it vertically up to make the darks lighter.
- Flexible
A characteristic of the “Standard” cubic spline curve is that editing one node could have a huge impact on what happens to the curve in relation to the other nodes. The “Flexible” centripetal Catmull–Rom spline curve allows you to make adjustments to any part of the curve with little impact on the other parts.
- Parametric
Allows you to use sliders rather than dragging the curve directly. For
the Parametric curve type, clicking the right mouse button over the zone
selector
 will reset the handles’ position to their default values. (The global
reset button will reset them too.)
will reset the handles’ position to their default values. (The global
reset button will reset them too.)
- Control Cage
At first sight this curve type looks very much like the Custom curve, but there are some differences. With the Custom curve, the curve touches all the control points. This is not the case with the control cage curve – the control points attract the curve towards them but the curve doesn’t actually go through them. Another difference is that the control cage allows for a straight section of the curve, while you can’t do this with the custom curve. The cage curve needs at least three points for that (so five in total). Holding down the Shift key while dragging a point will help you to easily create a straight line by snapping the point to the line made by the previous and next point (displayed in red by the ‘snap to’ tool). Many users prefer Control Cage type curves to the alternatives.
The Flat Curve
frame A number of tools in RawTherapee use the flat curve:
It’s very simple to use once you understand it, so let’s use the HSV Equalizer in the
 Color tab as an example. Click on the drop-down icon
image:Drop-down.png next to the H(ue)
button and choose “Minima/Maxima control points”
Color tab as an example. Click on the drop-down icon
image:Drop-down.png next to the H(ue)
button and choose “Minima/Maxima control points”
 .
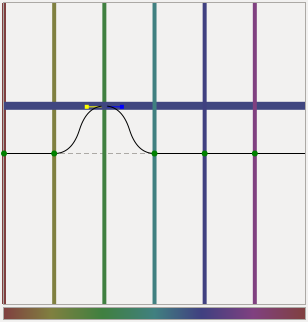
You’ll see six dots on the horizontal line in the middle and six
vertical lines that cross these dots. Notice that those lines are
colored; from left to right: red, yellow, green, aqua, blue and magenta.
Now click on the very left dot (the cursor changes into a little hand)
and move it slightly upward and downward. Result: red colors quickly
change to green, blue and magenta as the cursor is moved up, and to
pink, blue and green when moved down.
.
You’ll see six dots on the horizontal line in the middle and six
vertical lines that cross these dots. Notice that those lines are
colored; from left to right: red, yellow, green, aqua, blue and magenta.
Now click on the very left dot (the cursor changes into a little hand)
and move it slightly upward and downward. Result: red colors quickly
change to green, blue and magenta as the cursor is moved up, and to
pink, blue and green when moved down.
Notice that a new horizontal line appears when you start dragging a color point, and see how its color changes. The vertical axis represents input colors, and the horizontal axis output colors.
When you click and drag a vertical line (the line, not the point!), the very first movement will determine the kind of move: vertical or horizontal (so take care with this first movement if you want to have a predictable result). If you want to move the point in both directions at the same time, then click and drag the point itself. To move the point only in one direction (only horizontally or only vertically) you can use the ‘snap to’ function by holding down the Shift key while moving the point.
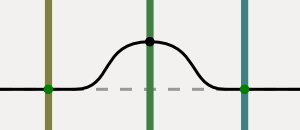
frame It’s easy to see if a point is on its neutral value (i.e. on the middle line) because the color of the point will be green. As soon as you move a point off its neutral value, it changes color to black.
The HSV Equalizer wraps around on the horizontal axis, so the very right vertical line equals the very left line. You can see this by dragging the red line on the left side a bit to the left. Now the left point of the graph is at the same position as the very right point. Holding the Shift key while dragging a point prevents it from wrapping around the horizontal axis, which can be useful in preventing accidental curve steps in hard-to-see places at the edges.
You can delete points by dragging them out of the editor field. You can add points by clicking somewhere on the curve. When you place the mouse on one of the points, you see a yellow and blue indicator. Place the mouse on the yellow one and the cursor changes into a left arrow. Now you can drag this point to the left, to change the slope of the curve. Ditto for the blue indicator.
To get an idea how this editor works, delete all but two colors (e.g. red and yellow) and move the graph around, change its slope and see what happens to your photo.
Reset the Hue curve to “Linear” (no changes) by clicking on the
reset icon  next to the Value button. To compare the effects of the Hue curve
with linear: switch between “Linear” and “Minima/Maxima control
points” in the drop-down menu next to this button, or use the history
list on the left side of your screen.
next to the Value button. To compare the effects of the Hue curve
with linear: switch between “Linear” and “Minima/Maxima control
points” in the drop-down menu next to this button, or use the history
list on the left side of your screen.
You can save a curve for later use by clicking on the disk button. Note that only the actual (shown) H, S or V curve is saved, not all three at once, so don’t give your curve a name like my_hsv because it doesn’t describe whether the curve inside it is H, S or V, but instead name your saved curve files something like my_hue, my_sat and my_val. The extension will be added automatically, “.rtc”.
Threshold Curves
Threshold Curves are the simplest. They are used to tell a RawTherapee tool the tones (or hues or saturations values) that you want processed (or processed differently).
As an example, consider the Threshold curve editor on the Detail ->
Sharpening tool.
 The setting shown is telling the Sharpening tool to phase in sharpening quickly in
the black areas (the steep line up on the left), maintain full
sharpening through mid-tones (the plateau area) and then phase out
sharpening slowly in the highlights (the long slope down). Dragging one
of the control points will move the slope leading up or down from the
point. To just move the point, but not the slope as a whole, hold down
the shift key while you drag.
The setting shown is telling the Sharpening tool to phase in sharpening quickly in
the black areas (the steep line up on the left), maintain full
sharpening through mid-tones (the plateau area) and then phase out
sharpening slowly in the highlights (the long slope down). Dragging one
of the control points will move the slope leading up or down from the
point. To just move the point, but not the slope as a whole, hold down
the shift key while you drag.
On the top right is a reset button that will reset back to default.
Warning: resetting the curve is considered a curve modification, so if you’ve just modified the curve and mistakenly pressed the Reset button, there’s no way to bring back your curve. (Ctrl-z will go one step before in the History list, not in the curve’s edition). This comment applies to Tone and Flat Curves as well.
You’ll also find Threshold Curves used in the Contrast by Detail Levels and the Vibrance tools.
You may have noticed that Threshold Curves actually consist of a few straight lines rather than a curve. If this bothers you, you might want to take a break before moving on to Flat Curves.
The Preview Area
The preview is designed to show you the most realistic result possible,
however one must keep in mind that the larger an image is, the longer it
takes to process. For speed reasons, the preview of the effects of most
tools is calculated not on the full-sized image (which would take
exactly as long as saving the image, making using sliders and curves
impossible), but on the preview image which is of the size of your
preview area. Many tools, such as the Exposure
tool, can be applied to an image of any size, and their effects will be
identical regardless of the size of the image they are applied to.
However some tools are size-dependent, for example all of the tools in
the Detail tab, which means if you apply one of these tools to a
full-sized image and to a smaller version of that image, and then
downscale the full-sized image to the smaller image’s size, the two
images won’t match. For reasons of speed, RawTherapee must use the small
preview image so that your tool tweaking experience may be fast and
fluid, but this means that the effects of size-dependent tools would not
be accurate when applied to a small zoomed-out preview. We made the
decision to either disable the preview effects of these tools entirely
at zoom levels less than 100%, or to keep the preview effects active but
to warn you that what you see at zoom levels less than 100% may be
inaccurate depending on the tool settings (for example Tone Mapping and Wavelet may
be accurate at zoom levels less than 100% or they may be inaccurate,
depending on their settings). You will know which tools these are
because they are marked with a “1:1” icon
 next to their names. RawPedia explains how accurate the preview is for
all affected tools on each tool’s page.
next to their names. RawPedia explains how accurate the preview is for
all affected tools on each tool’s page.